Hi Edmond and Team,
Thanks for creating the commonroad_search repo and especially the tutorials.
I found the first tutorials pretty cool to understand in which order the nodes are expanded and to see reasons why and how a valid solution is found. But I did not get it running for any other “complex” scenarios than the tutorial one:
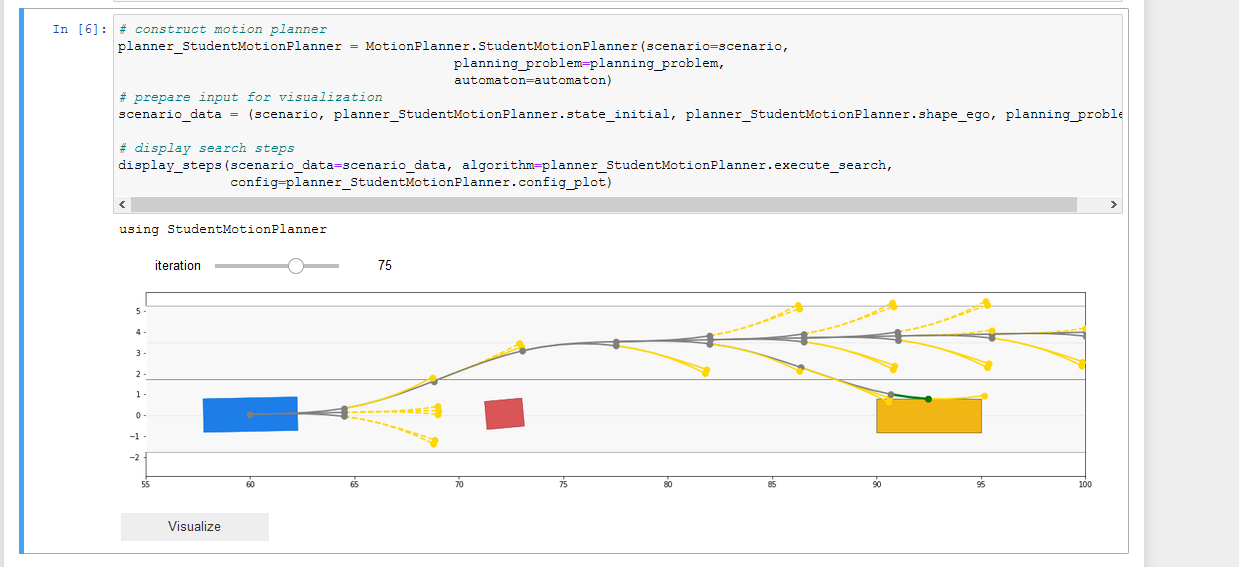
In my experience on running the scenarios, if found it pretty hard to tune all the parameters and functions heuristics in the search algorithm. Especially to understand why it takes sometimes pretty long, until a valid solution is found or why none is found. I ended up tuning a lot of functions “based on my own experience” of driving in a car (e.g. a good distance to other vehicles in meters etc.), because I had not enough computing power to tune this. I ended up printing the time t, and x,y coordinates for every expansion - not a great visualization, but good enough to understand that the heuristic function has problems to turn more than 90*.
The idea would be e.g. to plot the node density at time t (per m^2, like a heatmap) and a slider interactive element to control the time t.
Or does there exist something similar like that already? Is this anything that might be available in the future?
Best regards
Michael